> ## Documentation Index
> Fetch the complete documentation index at: https://docs.junojourney.com/llms.txt
> Use this file to discover all available pages before exploring further.
# Learning Management
> The most granular table in Juno — one row per learner and activity, with saved views, column groups, grouped roll-ups, and CSV export.
export const RelatedPages = ({pages = []}) => {
if (pages.length === 0) return null;
return <>
Related articles
{pages.map(page => )}
;
};
export const RoleBadge = ({roles = []}) => {
const colorMap = {
Admin: "yellow",
Manager: "blue",
Learner: "green",
"Co-editor": "purple"
};
return <>
{roles.map(role => {role}{" "})}
;
};
**Admin → Content → Learning Management** (`/admin/1/learning-management`) is the most granular view in Juno: **one row per learner and activity**. Use it to answer questions the analytics tabs can't, such as *"show every R\&D learner whose Compliance 2026 is overdue, with their manager and hire date, exported to CSV."*
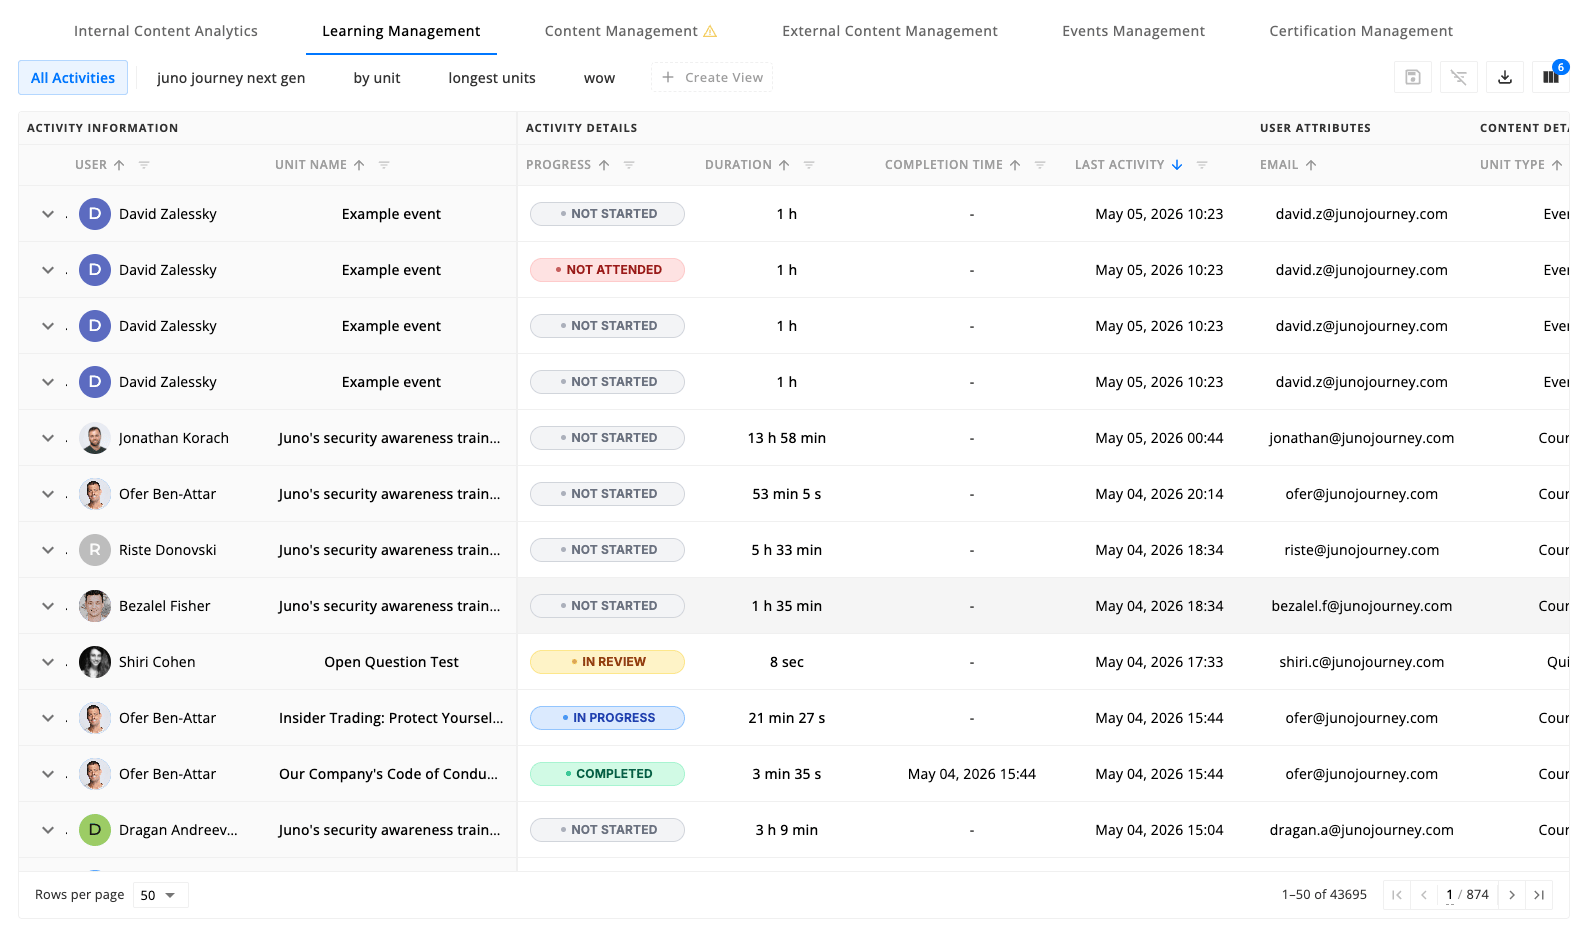 The table is built around four power-user concepts: **views**, the **column manager**, **grouped roll-ups**, and **CSV export**.
***
## Views
A **view** is a saved configuration of filters, sort, grouping, column order, and column visibility. Every admin can create their own, and views can be shared by link.
The default tab is **All Activities**. It can't be overwritten, but any customization you make on it can be captured as a new named view.
What a view stores:
* Filters (per-column conditions) and metric filters
* Sort order
* Grouping, and the column layout of both the grouped and drill-down layers
* Hidden columns and hidden column groups
* Column order
Select **Create View** to start a new empty view. Drag view tabs to reorder them.
### Per-view actions
| Action | What it does |
| ------------------- | ------------------------------------------------- |
| **Rename View** | Edit the view's name inline |
| **Duplicate** | Clone the view as a new starting point |
| **Copy Share Link** | Share the view's configuration with another admin |
| **Delete View** | Remove the view, after a confirmation step |
View names must be unique and are capped at 100 characters. If you enter a name that already exists, the dialog shows an inline error and the save button stays disabled.
### Saving changes
The toolbar save action is active only when there are unsaved edits, and an **Unsaved changes** chip appears while the view is dirty. On a saved view, saving updates it in place. On **All Activities**, saving opens **Save as new view** and asks for a name.
You'll be prompted to name a new view in three situations:
| Trigger | Prompt |
| -------------------------------------------------- | ---------------------------------------------------------- |
| You select the toolbar **Save as new view** action | Inline dialog asking for a view name |
| You switch to another view with unsaved changes | **Save & Switch**, or **Discard** to switch without saving |
| You navigate away with unsaved changes | **Save & Leave**, or **Discard** |
Discarding resets the table to the view's saved state. To keep your filters and column layout, choose **Save as new view** and give them a name.
### Shared views
A share link opens the table on whichever version the recipient can access — the admin table, or the manager table if that's their level. The recipient is prompted to save their own copy of the view under their own name, so edits never affect your original. Sharing a view shares its **configuration**, not its data: the recipient sees the table scoped to their own permissions.
***
## Column manager
The column-manager popover groups columns into **groups** that can be toggled together, and lets you **drag and drop** to reorder columns. The same popover and reorder behavior works in both the flat table and a grouped view, so muscle memory carries between the two.
| Group | Columns |
| ------------------------------------------- | ----------------------------------------------------------------------------------------------------------------------------------------------------------- |
| **Activity Information** *(always visible)* | User, Unit Name |
| **Activity Details** | Progress, Duration, Assigned, Started, Completed, Due Date, Submitted, Graded, Last Activity, Score, RSVP, Enrollment Type, Certificate |
| **User Attributes** | Email, Department, Location, Direct Manager, Company, User Status, Job Title, Position, HRBP Identifier, Role, Manager Email, Hire Date, User Type, User Id |
| **Content Details** | Provider, Unit Type, Content Created, Added to Academy, Language, Expected Duration, Content Creator, Price, Tags |
| **Event Details** | Event Name, Session Start, Session End, Session Location, Instructors, Label |
| **External Learning Fields** | Proof, Proof Type, Proof File, Proof Submitted At, Request, Request Status, Request Type, Request Tag, Request Created, Last Approver, Last Approval |
| **Survey Details** | Feedback Survey, Survey Status, Survey Completed |
Column visibility is **per-view** — each view can show a different slice. Toggle whole groups off when they aren't relevant, for example Event Details and External Learning Fields when you only care about self-paced learning.
**Duration** appears only when time-spent tracking is enabled for your organization. Any custom user attributes your organization defines appear as extra columns in **User Attributes**, each under its own name.
### Label column (Event Details)
Shows the **event label** for the session — the same colored chip that appears on the event itself, for example *Mandatory*, *New Hire*, or *Compliance*. The cell renders the label name on its configured background color; rows that aren't sessions show `-`.
Use the column filter to show only activities tied to one or more labels. Filtering is multi-select, so you can combine labels to scope the table to those sessions only.
**When to use it**
* Audit attendance against a specific compliance or onboarding label.
* Split event activities from self-paced learning in a saved view.
* Export a CSV of all session enrollments carrying a particular label.
### Proof Type and Request Tag columns (External Learning Fields)
**Proof Type** shows one or more proof-of-completion types attached to an external learning activity — for example *Certificate*, *Signature*, or a custom tag. Because a single activity can carry several, the column accepts a **multi-value filter**. **Proof File** links to the uploaded file itself.
**Request Tag** works the same way: it shows tags applied to an external-content request, used for Qualiopi audit trails and custom categorization. Both columns' filter states persist in the URL, so you can bookmark or share a view with those filters pre-applied.
**When to use them**
* Build a Qualiopi audit view by filtering **Proof Type** to *Signature* and exporting.
* Segment external requests by workflow tag using **Request Tag**.
### Tags column (Content Details)
Lists every **content tag** attached to the unit — outlined chips, with up to three visible and a `+N more` tooltip for the rest. Tags reflect the taxonomy assigned in the content editor (topic, skill area, audience) and are available on every unit type.
The column filter is multi-select and matches activities whose unit carries *any* of the chosen tags. Combine it with Provider, Department, or Status to build views such as *"all in-progress activities tagged `leadership` for the EMEA region."*
**When to use it**
* Build saved views per tagged learning track without listing every unit by name.
* Export completion data for a topic taxonomy, for example everything tagged `security`.
* Find untagged content by inverting the filter against a known tag set.
***
## Filtering, sorting, and searching
**Filters are per column.** Open a column's filter popover to set conditions on it; the toolbar shows a badge with how many filters are active, and **Clear all filters** resets them. Filter state persists in the URL, so a view's link carries its filters.
There is no global search box. Narrow the table with the **Unit Name** or **User** column filter instead.
**Sorting** is server-side and single-column. The table defaults to **Last Activity**, newest first. Six columns can't be sorted: User Id, Tags, Instructors, Label, Proof File, and Last Approver.
**There is no row selection and no bulk actions** in this table — it's built for reporting and export, not for acting on records. To assign, notify, or archive content, use the per-row actions on [Internal Content Analytics](/admin/content-management#internal-content-analytics).
***
## Row expansion
Select the chevron at the start of a row to expand it into that learner's **activity history** for that unit — a timestamped list of what happened and when, most recent first, capped at the latest 50 entries. Use it to see the sequence behind a status when a learner's progress looks wrong.
Rows for deleted records render faded rather than disappearing, so historical activity stays visible.
***
## Grouped views
Switch from the default row-per-learner-and-activity layout into a **grouped view** to roll the table up by an attribute. Select **Add grouping** in the toolbar, then pick a field; **Clear grouping** returns to the flat table.
| Group by a person | Group by content |
| ----------------------------------------------------- | ---------------------------------------------------- |
| User, Department, Location, Direct Manager, Job Title | Unit, Unit Type, Language, Provider, Content Creator |
What you can do in a grouped view:
* **Aggregate numeric columns** — each numeric column shows a metric per group. Pick the aggregation from the column header.
* **Pre-group filter** — narrow the underlying activities before they're rolled up, for example group by Department but only over the last 30 days of activity.
* **Drill down** — select any group row to expand into the activities behind that aggregate.
* **Export** — CSV export respects the grouped layout and current aggregations.
When you **group by Unit**, events with multiple sessions show one row per session instead of collapsing every session into a single event row. This keeps per-session enrollment, attendance, and duration visible at a glance, and drilling into a session row filters to that session's activities.
### Available aggregations
| Column | Aggregations |
| ------------------------------------------------------------------------------------------------------------------------------ | --------------------------------------------------- |
| **Duration** and **Expected Duration** | SUM, AVG, MIN, MAX |
| **Price** | SUM, AVG, MIN, MAX (shown with the currency symbol) |
| **Score** | AVG, MIN, MAX |
| **Date columns** (Assigned, Started, Completed, Due Date, Submitted, Graded, Last Activity, Proof Submitted At, Last Approval) | MIN, MAX |
| **Count metrics** (enrolled, completed, started, and so on) | COUNT |
Use **SUM** when you care about totals ("how many learner-hours did Sales spend on Compliance 2026?"). Use **AVG** when you care about per-learner intensity ("what's the average time a learner spends on this Journey?"). Use **MIN** or **MAX** on dates to find the first or last activity in a group.
### Breakdown columns
In a grouped view, add **breakdown** columns to see the full mix of statuses for a group in one column instead of one numeric column per status. Each breakdown renders as a single-cell stacked bar. Hover any bar to see each bucket's label, count, and percentage.
| Breakdown column | Buckets | Scope |
| ------------------------------ | -------------------------------------------------------------------- | -------------------------------------------------------------- |
| **Learning status breakdown** | Completed, In progress, Not started, Failed, Overdue | Non-event content (Journeys, quizzes, videos, articles, SCORM) |
| **Attendance breakdown** | Attended, No-show, Upcoming | Event-type content only |
| **RSVP breakdown** | Going, Maybe, Not going, No response | Event-type content only — intent before attendance is recorded |
| **Purchase request breakdown** | Approved, Awaiting approval, Awaiting purchase, Declined or canceled | External marketplace activities only |
Each breakdown scopes to one row type so the labels always match the activity's lifecycle. A Journey never falls into the *Attendance* breakdown, and an event never falls into the *Learning status* breakdown — buckets that don't apply contribute 0.
**When to use them**
* **Learning status breakdown** — answer "how is each department progressing through this Journey?" in a single column.
* **Attendance breakdown** — spot which sessions had high no-show rates when you group by Unit.
* **RSVP breakdown** — gauge expected turnout before an event happens.
* **Purchase request breakdown** — track the marketplace approval funnel by Department or Provider.
### RSVP and attendance metrics
When you group an events-heavy view, the **Engagement** section exposes individual count columns for each RSVP and attendance state:
| Metric | What it counts |
| --------------- | --------------------------------------- |
| **Going** | People who accepted the invitation |
| **Maybe** | People who responded tentatively |
| **Not Going** | People who declined the invitation |
| **No Response** | Invitees who never replied |
| **Attended** | People marked as having shown up |
| **No-show** | People who registered but didn't attend |
RSVP fields capture **intent before the event**. Attendance fields capture **what actually happened**. Juno tracks the two separately, so a learner who RSVP'd *Going* but didn't show up appears under both *Going* and *No-show*. Non-event content contributes 0 to every RSVP and attendance metric.
### Purchase request metrics
For organizations using external content with approval workflows, the **Progress** section includes a column for each request state — **Approved Requests**, **Requests Awaiting Approval**, **Requests Awaiting Purchase**, and **Declined / Canceled Requests**. Internal content has no request workflow and contributes 0 to each.
The **Not Started** metric counts every non-event activity a learner hasn't opened yet — both **assigned** and **voluntary**. This aligns with how Completed and In Progress are counted, so the three buckets add up to the same population on every row.
***
## Export to CSV
**Export to CSV** exports **the current view's visible columns**, applying the current filters, sort, and grouping. Toggle a column on before exporting if you need it.
The export runs in the background. You'll see **"Export started"** straight away, then a notification when the file is ready — select it to return here and download. Very large exports are supported, which is why the work happens asynchronously rather than while you wait. If the export can't start, Juno says so and you can retry.
***
## Managers
Managers have their own version of this table at **Managers → Content → Learning Management**, automatically scoped to their direct reports. It shares the views, column manager, and grouping behavior described here. See [Learning Activities (Managers)](/managers/learning-activities).
The table is built around four power-user concepts: **views**, the **column manager**, **grouped roll-ups**, and **CSV export**.
***
## Views
A **view** is a saved configuration of filters, sort, grouping, column order, and column visibility. Every admin can create their own, and views can be shared by link.
The default tab is **All Activities**. It can't be overwritten, but any customization you make on it can be captured as a new named view.
What a view stores:
* Filters (per-column conditions) and metric filters
* Sort order
* Grouping, and the column layout of both the grouped and drill-down layers
* Hidden columns and hidden column groups
* Column order
Select **Create View** to start a new empty view. Drag view tabs to reorder them.
### Per-view actions
| Action | What it does |
| ------------------- | ------------------------------------------------- |
| **Rename View** | Edit the view's name inline |
| **Duplicate** | Clone the view as a new starting point |
| **Copy Share Link** | Share the view's configuration with another admin |
| **Delete View** | Remove the view, after a confirmation step |
View names must be unique and are capped at 100 characters. If you enter a name that already exists, the dialog shows an inline error and the save button stays disabled.
### Saving changes
The toolbar save action is active only when there are unsaved edits, and an **Unsaved changes** chip appears while the view is dirty. On a saved view, saving updates it in place. On **All Activities**, saving opens **Save as new view** and asks for a name.
You'll be prompted to name a new view in three situations:
| Trigger | Prompt |
| -------------------------------------------------- | ---------------------------------------------------------- |
| You select the toolbar **Save as new view** action | Inline dialog asking for a view name |
| You switch to another view with unsaved changes | **Save & Switch**, or **Discard** to switch without saving |
| You navigate away with unsaved changes | **Save & Leave**, or **Discard** |
Discarding resets the table to the view's saved state. To keep your filters and column layout, choose **Save as new view** and give them a name.
### Shared views
A share link opens the table on whichever version the recipient can access — the admin table, or the manager table if that's their level. The recipient is prompted to save their own copy of the view under their own name, so edits never affect your original. Sharing a view shares its **configuration**, not its data: the recipient sees the table scoped to their own permissions.
***
## Column manager
The column-manager popover groups columns into **groups** that can be toggled together, and lets you **drag and drop** to reorder columns. The same popover and reorder behavior works in both the flat table and a grouped view, so muscle memory carries between the two.
| Group | Columns |
| ------------------------------------------- | ----------------------------------------------------------------------------------------------------------------------------------------------------------- |
| **Activity Information** *(always visible)* | User, Unit Name |
| **Activity Details** | Progress, Duration, Assigned, Started, Completed, Due Date, Submitted, Graded, Last Activity, Score, RSVP, Enrollment Type, Certificate |
| **User Attributes** | Email, Department, Location, Direct Manager, Company, User Status, Job Title, Position, HRBP Identifier, Role, Manager Email, Hire Date, User Type, User Id |
| **Content Details** | Provider, Unit Type, Content Created, Added to Academy, Language, Expected Duration, Content Creator, Price, Tags |
| **Event Details** | Event Name, Session Start, Session End, Session Location, Instructors, Label |
| **External Learning Fields** | Proof, Proof Type, Proof File, Proof Submitted At, Request, Request Status, Request Type, Request Tag, Request Created, Last Approver, Last Approval |
| **Survey Details** | Feedback Survey, Survey Status, Survey Completed |
Column visibility is **per-view** — each view can show a different slice. Toggle whole groups off when they aren't relevant, for example Event Details and External Learning Fields when you only care about self-paced learning.
**Duration** appears only when time-spent tracking is enabled for your organization. Any custom user attributes your organization defines appear as extra columns in **User Attributes**, each under its own name.
### Label column (Event Details)
Shows the **event label** for the session — the same colored chip that appears on the event itself, for example *Mandatory*, *New Hire*, or *Compliance*. The cell renders the label name on its configured background color; rows that aren't sessions show `-`.
Use the column filter to show only activities tied to one or more labels. Filtering is multi-select, so you can combine labels to scope the table to those sessions only.
**When to use it**
* Audit attendance against a specific compliance or onboarding label.
* Split event activities from self-paced learning in a saved view.
* Export a CSV of all session enrollments carrying a particular label.
### Proof Type and Request Tag columns (External Learning Fields)
**Proof Type** shows one or more proof-of-completion types attached to an external learning activity — for example *Certificate*, *Signature*, or a custom tag. Because a single activity can carry several, the column accepts a **multi-value filter**. **Proof File** links to the uploaded file itself.
**Request Tag** works the same way: it shows tags applied to an external-content request, used for Qualiopi audit trails and custom categorization. Both columns' filter states persist in the URL, so you can bookmark or share a view with those filters pre-applied.
**When to use them**
* Build a Qualiopi audit view by filtering **Proof Type** to *Signature* and exporting.
* Segment external requests by workflow tag using **Request Tag**.
### Tags column (Content Details)
Lists every **content tag** attached to the unit — outlined chips, with up to three visible and a `+N more` tooltip for the rest. Tags reflect the taxonomy assigned in the content editor (topic, skill area, audience) and are available on every unit type.
The column filter is multi-select and matches activities whose unit carries *any* of the chosen tags. Combine it with Provider, Department, or Status to build views such as *"all in-progress activities tagged `leadership` for the EMEA region."*
**When to use it**
* Build saved views per tagged learning track without listing every unit by name.
* Export completion data for a topic taxonomy, for example everything tagged `security`.
* Find untagged content by inverting the filter against a known tag set.
***
## Filtering, sorting, and searching
**Filters are per column.** Open a column's filter popover to set conditions on it; the toolbar shows a badge with how many filters are active, and **Clear all filters** resets them. Filter state persists in the URL, so a view's link carries its filters.
There is no global search box. Narrow the table with the **Unit Name** or **User** column filter instead.
**Sorting** is server-side and single-column. The table defaults to **Last Activity**, newest first. Six columns can't be sorted: User Id, Tags, Instructors, Label, Proof File, and Last Approver.
**There is no row selection and no bulk actions** in this table — it's built for reporting and export, not for acting on records. To assign, notify, or archive content, use the per-row actions on [Internal Content Analytics](/admin/content-management#internal-content-analytics).
***
## Row expansion
Select the chevron at the start of a row to expand it into that learner's **activity history** for that unit — a timestamped list of what happened and when, most recent first, capped at the latest 50 entries. Use it to see the sequence behind a status when a learner's progress looks wrong.
Rows for deleted records render faded rather than disappearing, so historical activity stays visible.
***
## Grouped views
Switch from the default row-per-learner-and-activity layout into a **grouped view** to roll the table up by an attribute. Select **Add grouping** in the toolbar, then pick a field; **Clear grouping** returns to the flat table.
| Group by a person | Group by content |
| ----------------------------------------------------- | ---------------------------------------------------- |
| User, Department, Location, Direct Manager, Job Title | Unit, Unit Type, Language, Provider, Content Creator |
What you can do in a grouped view:
* **Aggregate numeric columns** — each numeric column shows a metric per group. Pick the aggregation from the column header.
* **Pre-group filter** — narrow the underlying activities before they're rolled up, for example group by Department but only over the last 30 days of activity.
* **Drill down** — select any group row to expand into the activities behind that aggregate.
* **Export** — CSV export respects the grouped layout and current aggregations.
When you **group by Unit**, events with multiple sessions show one row per session instead of collapsing every session into a single event row. This keeps per-session enrollment, attendance, and duration visible at a glance, and drilling into a session row filters to that session's activities.
### Available aggregations
| Column | Aggregations |
| ------------------------------------------------------------------------------------------------------------------------------ | --------------------------------------------------- |
| **Duration** and **Expected Duration** | SUM, AVG, MIN, MAX |
| **Price** | SUM, AVG, MIN, MAX (shown with the currency symbol) |
| **Score** | AVG, MIN, MAX |
| **Date columns** (Assigned, Started, Completed, Due Date, Submitted, Graded, Last Activity, Proof Submitted At, Last Approval) | MIN, MAX |
| **Count metrics** (enrolled, completed, started, and so on) | COUNT |
Use **SUM** when you care about totals ("how many learner-hours did Sales spend on Compliance 2026?"). Use **AVG** when you care about per-learner intensity ("what's the average time a learner spends on this Journey?"). Use **MIN** or **MAX** on dates to find the first or last activity in a group.
### Breakdown columns
In a grouped view, add **breakdown** columns to see the full mix of statuses for a group in one column instead of one numeric column per status. Each breakdown renders as a single-cell stacked bar. Hover any bar to see each bucket's label, count, and percentage.
| Breakdown column | Buckets | Scope |
| ------------------------------ | -------------------------------------------------------------------- | -------------------------------------------------------------- |
| **Learning status breakdown** | Completed, In progress, Not started, Failed, Overdue | Non-event content (Journeys, quizzes, videos, articles, SCORM) |
| **Attendance breakdown** | Attended, No-show, Upcoming | Event-type content only |
| **RSVP breakdown** | Going, Maybe, Not going, No response | Event-type content only — intent before attendance is recorded |
| **Purchase request breakdown** | Approved, Awaiting approval, Awaiting purchase, Declined or canceled | External marketplace activities only |
Each breakdown scopes to one row type so the labels always match the activity's lifecycle. A Journey never falls into the *Attendance* breakdown, and an event never falls into the *Learning status* breakdown — buckets that don't apply contribute 0.
**When to use them**
* **Learning status breakdown** — answer "how is each department progressing through this Journey?" in a single column.
* **Attendance breakdown** — spot which sessions had high no-show rates when you group by Unit.
* **RSVP breakdown** — gauge expected turnout before an event happens.
* **Purchase request breakdown** — track the marketplace approval funnel by Department or Provider.
### RSVP and attendance metrics
When you group an events-heavy view, the **Engagement** section exposes individual count columns for each RSVP and attendance state:
| Metric | What it counts |
| --------------- | --------------------------------------- |
| **Going** | People who accepted the invitation |
| **Maybe** | People who responded tentatively |
| **Not Going** | People who declined the invitation |
| **No Response** | Invitees who never replied |
| **Attended** | People marked as having shown up |
| **No-show** | People who registered but didn't attend |
RSVP fields capture **intent before the event**. Attendance fields capture **what actually happened**. Juno tracks the two separately, so a learner who RSVP'd *Going* but didn't show up appears under both *Going* and *No-show*. Non-event content contributes 0 to every RSVP and attendance metric.
### Purchase request metrics
For organizations using external content with approval workflows, the **Progress** section includes a column for each request state — **Approved Requests**, **Requests Awaiting Approval**, **Requests Awaiting Purchase**, and **Declined / Canceled Requests**. Internal content has no request workflow and contributes 0 to each.
The **Not Started** metric counts every non-event activity a learner hasn't opened yet — both **assigned** and **voluntary**. This aligns with how Completed and In Progress are counted, so the three buckets add up to the same population on every row.
***
## Export to CSV
**Export to CSV** exports **the current view's visible columns**, applying the current filters, sort, and grouping. Toggle a column on before exporting if you need it.
The export runs in the background. You'll see **"Export started"** straight away, then a notification when the file is ready — select it to return here and download. Very large exports are supported, which is why the work happens asynchronously rather than while you wait. If the export can't start, Juno says so and you can retry.
***
## Managers
Managers have their own version of this table at **Managers → Content → Learning Management**, automatically scoped to their direct reports. It shares the views, column manager, and grouping behavior described here. See [Learning Activities (Managers)](/managers/learning-activities).