Overview
Admin → Analytics (/admin/2) provides organization-wide insights into learning activity, engagement, and performance. Managers also have access to this tab for their team scope.
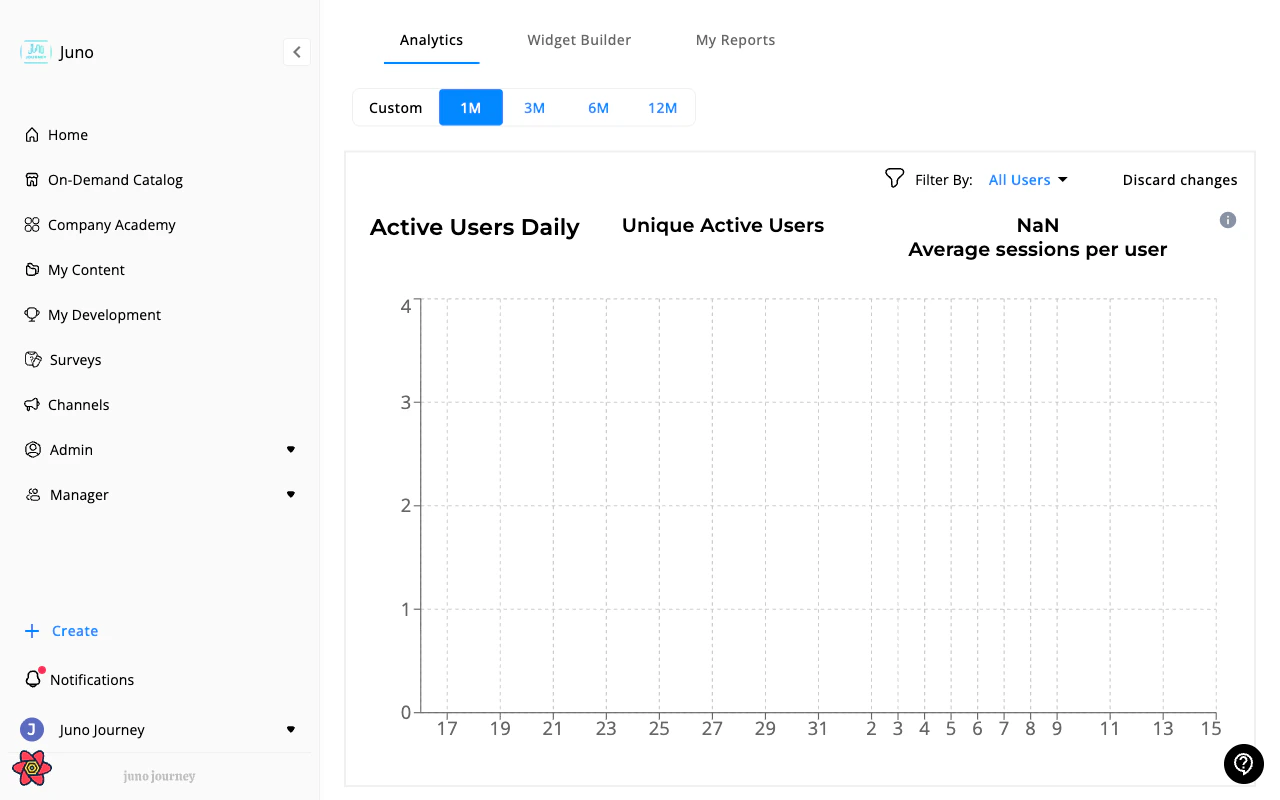
Sub-tabs
Analytics
The main analytics dashboard with organization-wide metrics:| Category | What you can track |
|---|---|
| Content | Enrollment trends, completion rates, time spent, top courses |
| Users | Active users, engagement levels, retention |
| Journeys | Completion rates, time to completion, performance by department |
| Budget | Utilization trends, spend by category |
| Events | Attendance rates, event popularity |
Widget Builder
Build custom analytics widgets and assemble them into dashboards. Each widget visualizes one analytics event with chosen breakdowns and filters.Widget Builder requires the
CAN_SEE_ANALYTICS_WIDGETS_BUILDER feature flag to be enabled.| Parameter | What it does |
|---|---|
| Event | The analytics event to measure (course enrollment, completion, login, etc.) |
| Value type | Count, unique users, average, sum |
| Chart type | Bar, pie, line, table |
| Breakdown | Group by department, role, content, time period, etc. |
| Filters | Narrow the data (e.g. department = Engineering, date range) |
- Edit — adjust parameters
- Export — download chart data as CSV
- Add to overview — pin to the main Analytics dashboard
Skills analytics
Track skill development and competency growth across your organization.Skills analytics requires the
CAN_SEE_SKILLS_ANALYTICS feature flag to be enabled.My reports
Create, download, and schedule custom analytics reports. See Analytics Reports for full details on report creation, scheduling, and delivery management.Per-training analytics
Every course, quiz, SCORM package, Journey, and survey has a dedicated analytics view with learner tables, status breakdowns, and bulk actions. See Training Analytics and Training Analytics Actions.Learning activities
The Learning activities table at Admin → Content → Learning management shows every learner’s interaction with every training unit in one filterable, exportable table. See Content & Learning management — Learning management. Managers see a direct-reports-scoped version of this table at Managers → Content → Learning Activities — see Learning Activities (Managers).Manager vs. Admin view
Managers see the same Analytics tab at/managers/2 but scoped to their team. Admins see organization-wide data.